Best Tools for Real-Time Data Analysis and Monitoring
Real-time data analysis processes data as it arrives, enabling immediate responses to changing conditions. Use cases include monitoring website traffic, tracking server performance, detecting fraud in financial transactions, and managing supply chain logistics. The tools for real-time analysis differ from batch processing tools in that they must handle continuous data streams, update dashboards within seconds, and trigger alerts when thresholds are exceeded.
Streaming Data Platforms: Apache Kafka
Apache Kafka is a distributed event streaming platform that handles real-time data feeds at scale. Producers write events to Kafka topics, and consumers read and process those events. Kafka stores events for a configurable retention period, allowing consumers to replay data if needed. It can process millions of events per second across a cluster of machines.
For data analysts, Kafka is typically used as the transport layer that moves data from source systems (databases, applications, IoT sensors) to processing engines. You would not interact with Kafka directly; instead, you use tools built on top of it. Confluent (the company founded by Kafka's creators) offers a managed Kafka service with a schema registry, connectors for common data sources, and ksqlDB, a SQL engine for querying Kafka streams in real time.

Real-Time Dashboards: Grafana
Grafana is an open-source dashboard and monitoring platform designed for time-series data. It connects to data sources like Prometheus, InfluxDB, Elasticsearch, and cloud monitoring services (AWS CloudWatch, Google Cloud Monitoring). You build dashboards with panels that display metrics as time-series charts, gauges, heatmaps, tables, and stat cards. Each panel queries the data source and refreshes at a configurable interval (every 5 seconds, 30 seconds, or 1 minute, for example).
Grafana's alerting system is one of its strongest features. You define alert rules based on thresholds (e.g., "alert when CPU usage exceeds 90% for 5 minutes") or on the absence of data (e.g., "alert when no data has been received for 10 minutes"). Alerts can be sent via email, Slack, PagerDuty, or webhooks. This makes Grafana essential for operations teams that need to respond to issues immediately.
Real-Time Analytics Databases: ClickHouse and Druid
ClickHouse is an open-source column-oriented database management system designed for real-time analytical queries on large datasets. It ingests data at high throughput (millions of rows per second) and returns query results in sub-second time for aggregations on billions of rows. ClickHouse uses SQL as its query language, so analysts familiar with SQL can query streaming data without learning a new language.
Apache Druid is another real-time analytics database, optimized for OLAP queries on event data. It supports sub-second queries on datasets with trillions of events and is used by companies like Netflix and Airbnb for real-time analytics. Druid's strength is its ability to both ingest and query data simultaneously without performance degradation, which is critical for monitoring applications where data arrives continuously.

Real-Time BI Tools
Traditional BI tools like Tableau and Power BI are designed for batch data, but some offer real-time or near-real-time capabilities. Tableau's Live Connection mode queries the data source each time a user interacts with the dashboard, providing up-to-date results. Power BI's DirectQuery mode works similarly, sending SQL queries to the underlying database on each interaction. Both modes require a database that can handle the query load, as each user interaction triggers a new query.
For lightweight real-time dashboards, Google Sheets combined with Google Apps Script can update data every minute. You can use IMPORTDATA() or custom functions to fetch data from APIs, and a time-driven trigger in Apps Script to refresh the data and send alerts. This approach is limited to small datasets but works well for personal monitoring dashboards or small team use cases.
Alerting and Notification Systems
Real-time monitoring is only useful if the right people are notified when something needs attention. PagerDuty and Opsgenie manage on-call schedules and escalate alerts through phone calls, SMS, and push notifications. They integrate with monitoring tools like Grafana, Datadog, and New Relic, so alerts from any source are routed through a single escalation system.

For business metrics (rather than infrastructure metrics), tools like Datadog and New Relic provide real-time monitoring with customizable dashboards and alerting. Datadog supports over 600 integrations, so you can monitor application performance, infrastructure, logs, and business metrics in a single platform. Its Watchdog feature uses machine learning to detect anomalies automatically, reducing the need for manual threshold configuration.
Choosing the Right Real-Time Tool
If you are monitoring infrastructure or application performance, Grafana with Prometheus or InfluxDB is the standard open-source stack. If you need to run SQL queries on streaming data, ClickHouse or ksqlDB provide the best combination of performance and familiarity. If your organization already uses a cloud provider, AWS offers Kinesis (streaming), CloudWatch (monitoring), and QuickSight (dashboards), while Google Cloud offers Dataflow (streaming), Cloud Monitoring, and Looker (dashboards). The key decision is whether you need true real-time (sub-second latency) or near-real-time (minutes) is sufficient, as the former requires significantly more infrastructure investment.
Scaling Your Real-Time Infrastructure
As your data volume grows, your real-time pipeline needs to scale accordingly. Start by estimating your peak data throughput in events per second and choose tools that can handle at least three times that volume. Grafana dashboards can become slow when querying large datasets, so implement data rollup policies that aggregate high-resolution data into lower-resolution summaries over time. For streaming pipelines, consider using Apache Kafka as a message buffer between your data sources and processing tools. Kafka handles millions of events per second and provides durability guarantees that prevent data loss during system failures. Budget for monitoring your monitoring systems themselves, as these pipelines can fail silently and produce stale dashboards without obvious warning signs.
Start with a simple monitoring setup and expand as your needs grow. Implement basic dashboards first, then add alerting, then add automated remediation (scripts that automatically fix common issues when alerts trigger). This incremental approach ensures that each layer is stable before adding the next, reducing the risk of alert fatigue and operational complexity.
Building a Real-Time Monitoring Dashboard
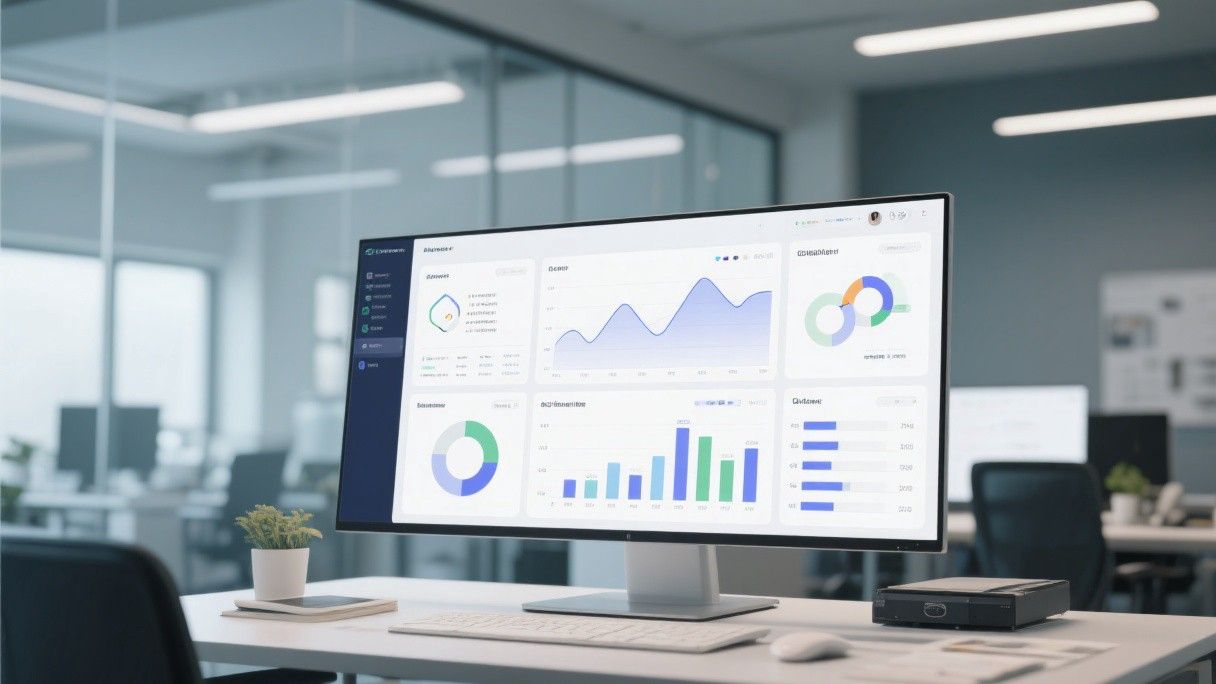
When building a real-time monitoring dashboard, start with the key metrics that require immediate attention. For a server monitoring dashboard, these might include CPU usage, memory consumption, disk I/O, and error rates. For a sales dashboard, track orders per minute, revenue, and cart abandonment rate. Place the most critical metrics at the top of the dashboard in large, high-contrast displays. Use conditional formatting to highlight values that exceed thresholds (red for critical, yellow for warning, green for normal).
Set up alert rules that trigger notifications when metrics cross defined thresholds. Grafana supports multiple alert channels including email, Slack, PagerDuty, and webhook integrations. Configure alerts to include context (the current value, the threshold, and a link to the dashboard) so that responders can quickly assess the situation. Avoid alert fatigue by tuning thresholds carefully: too many alerts cause teams to ignore them, while too few alerts mean issues go unnoticed. Review and adjust your alert thresholds monthly based on actual incident data.