How to Automate Data Analysis Reports

Manually creating data analysis reports every week or month is repetitive and time-consuming. Automation lets you set up a pipeline that pulls fresh data, performs the analysis, generates the report, and delivers it to stakeholders on a schedule. This article explains how to automate reports using tools ranging from spreadsheet formulas to Python scripts and cloud platforms.
Spreadsheet Automation: Refresh and Distribute
The simplest form of report automation uses Google Sheets or Excel with connected data sources. In Google Sheets, use IMPORTRANGE to pull data from another spreadsheet, IMPORTDATA to fetch CSV files from a URL, or the Google Sheets API to connect to external databases. Once the data is linked, your formulas, pivot tables, and charts update automatically when the source data changes.
To distribute the report automatically, use Google Apps Script. Open your Google Sheet, go to Extensions > Apps Script, and write a function that emails the report as a PDF attachment on a schedule. The script uses SpreadsheetApp.getActiveSpreadsheet() to access the sheet, creates a PDF using getBlob().getAs('application/pdf'), and sends it via GmailApp.sendEmail(). Set a time-driven trigger to run this function every Monday at 8 AM, and stakeholders receive a fresh report in their inbox without any manual effort.

Python Automation with openpyxl and ReportLab
For more complex reports, Python provides full control over data processing, formatting, and output. The openpyxl library creates and modifies Excel files programmatically. You can load data from a database using SQLAlchemy, perform calculations with Pandas, and write the results to a formatted Excel workbook with headers, number formatting, conditional formatting, and charts.
A typical automated report script follows this pattern: connect to the database and run the query, load the results into a Pandas DataFrame, perform calculations (grouping, filtering, variance analysis), create a new Excel workbook with openpyxl, write headers and data rows with proper formatting, add charts using openpyxl's chart module, save the file, and send it via email using the smtplib library or upload it to a shared drive using the Google Drive API or SharePoint API.
Scheduled Pipeline with Apache Airflow
For organizations that run multiple automated reports, Apache Airflow provides a platform for scheduling and monitoring data pipelines. Airflow represents each report as a Directed Acyclic Graph (DAG) with tasks connected by dependencies. A DAG for a daily sales report might have the following tasks: extract data from the sales database, transform it (clean, aggregate, calculate metrics), load it into a reporting table, generate the Excel report, and email it to the distribution list.
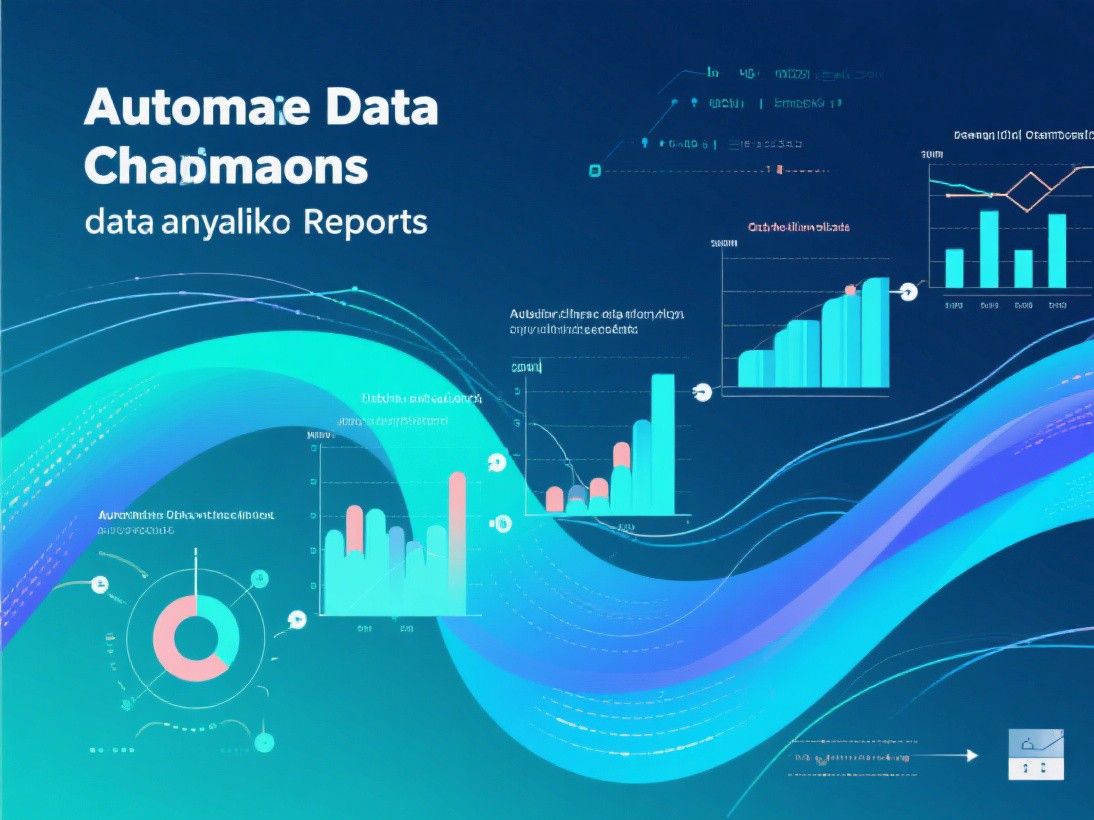
Airflow handles retries (if a task fails, it retries according to your configuration), alerting (send a Slack or email notification on failure), and dependency management (do not generate the report until the data extraction is complete). It also provides a web interface where you can monitor the status of all your scheduled reports, view logs, and trigger manual runs.
Power BI Scheduled Refresh
If you use Power BI for your reports, the Power BI Service handles scheduling for you. After publishing your report to app.powerbi.com, go to the dataset settings and configure a scheduled refresh. The service connects to your data source at the specified interval (daily, weekly), refreshes the data, and updates the published report. Stakeholders who have access to the report always see the latest data when they open it.
For email delivery, Power BI supports paginated reports (created in Power BI Report Builder) that can be exported to PDF and emailed on a schedule. This is useful for executives who prefer to receive a static report in their inbox rather than logging into the Power BI Service. The subscription feature lets each user set their own delivery frequency and format preferences.
Low-Code Automation with Zapier and Make
Zapier and Make (formerly Integromat) connect different applications without code. You can create a workflow that triggers when new data arrives in a specific location (a new row in Google Sheets, a new file in a cloud storage folder, a webhook from your application), processes the data (using built-in formatter tools or connecting to a data transformation service), and sends the output to the destination (email, Slack, Google Drive, or a reporting tool).

For example, a Zapier workflow for a weekly marketing report might work as follows: every Monday at 7 AM, Zapier fetches the previous week's data from Google Analytics (using the Google Analytics API integration), formats it in a Google Sheet template, generates a PDF of the sheet, and emails it to the marketing team. The entire workflow is configured through a visual interface without writing any code.
Monitoring and Maintaining Automated Reports
Automated reports break when source data changes format, when database credentials expire, or when API endpoints are updated. Set up monitoring to catch these failures. In Python scripts, use try-except blocks and send an alert when an exception occurs. In Airflow, configure on-failure callbacks. In Power BI, monitor refresh history in the dataset settings. Check your automated reports at least monthly to verify they are running correctly and producing accurate results. Even fully automated reports need periodic human review to ensure data quality and relevance.
Security and Access Control
Automated reports often contain sensitive data, so implement appropriate access controls. In Python scripts, store database credentials in environment variables or a secrets manager (AWS Secrets Manager, HashiCorp Vault) rather than hardcoding them in the script. In Power BI, use row-level security to ensure each user sees only the data they are authorized to access. In Google Sheets, restrict sharing to specific email addresses rather than making the document public.
Encrypt data in transit (use HTTPS for API calls, TLS for database connections) and at rest (use encrypted storage for exported files). For reports that contain personally identifiable information (PII), consider anonymizing or aggregating the data before including it in the report. Audit your automated reports quarterly to verify that access controls are still appropriate and that no sensitive data has been inadvertently exposed.
Scheduling and Error Handling
Robust automation requires proper scheduling and error handling. Use cron expressions in Airflow or Prefect to define complex schedules (e.g., "run on the first business day of each month" or "run every weekday at 6 AM"). Set up alerting so that you are notified immediately when a pipeline fails. Slack webhooks, email notifications, and PagerDuty integrations are common alerting channels. Include retry logic in your pipeline so that transient failures (network timeouts, API rate limits) are handled automatically without manual intervention.
Logging is equally important. Write detailed logs for each pipeline step, including the number of rows processed, the time taken, and any warnings or errors. Store logs in a centralized location (CloudWatch, Elasticsearch, or a dedicated logging database) so you can search and analyze them. When a pipeline fails, good logs reduce the time to diagnose and fix the issue from hours to minutes. This operational discipline is what separates reliable automated reporting from fragile scripts that break silently.