How to Create Funnel Analysis for Conversion Optimization
Funnel analysis tracks the steps users take toward a conversion goal (a purchase, a sign-up, a form submission) and measures the drop-off rate at each step. By identifying where users abandon the process, you can focus optimization efforts on the steps that have the biggest impact on conversion. This article explains how to create funnel analyses using different tools and how to interpret the results.
Defining Your Conversion Funnel
A conversion funnel consists of a sequence of steps that lead to a goal. For an e-commerce website, the funnel might be: (1) Visit product page, (2) Add to cart, (3) Start checkout, (4) Enter shipping info, (5) Enter payment info, (6) Complete purchase. For a SaaS product: (1) Visit landing page, (2) Sign up for free trial, (3) Complete onboarding, (4) Use core feature, (5) Upgrade to paid plan.
The key is to define steps that are measurable and sequential. Each step should correspond to a trackable event in your analytics tool. Avoid defining too many steps (more than 7-8 makes the funnel hard to interpret) or too few (fewer than 3 does not provide enough granularity to identify specific drop-off points). The steps should represent meaningful milestones in the user journey, not arbitrary page views.
Funnel Analysis in Google Analytics 4
GA4 provides a funnel exploration report in the "Explore" section. Open GA4, click "Explore," then select "Funnel exploration." Define your funnel steps by selecting events from your event list. For an e-commerce funnel, you might select: "page_view" (filtered to product pages), "add_to_cart," "begin_checkout," "add_payment_info," and "purchase." GA4 shows the number of users who completed each step, the drop-off rate between consecutive steps, and the overall conversion rate from step 1 to the final step.
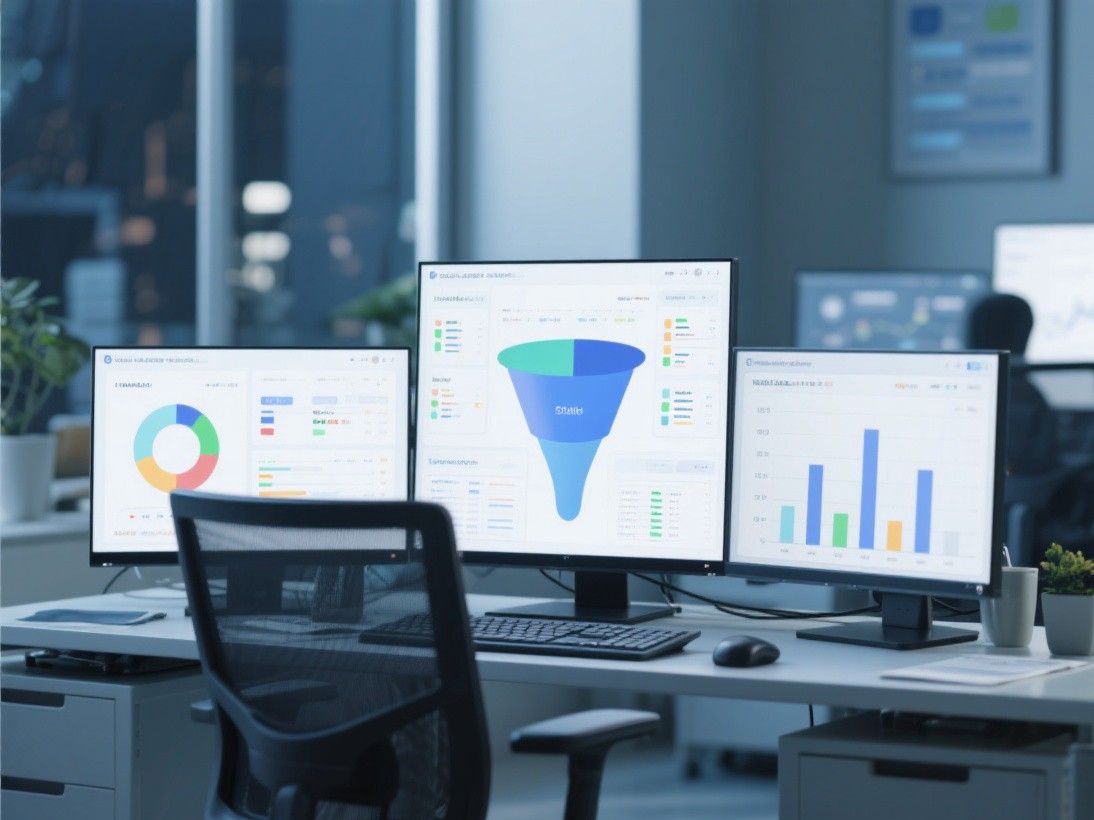
GA4's funnel exploration also supports "funnel breakdown," which segments the funnel by a dimension (e.g., device category, traffic source, user demographic). This lets you see whether mobile users have a higher drop-off rate than desktop users, or whether users from organic search convert better than users from paid ads. The breakdown feature is valuable for identifying which audience segments need targeted optimization.
Funnel Analysis in Mixpanel and Amplitude
Mixpanel and Amplitude are product analytics platforms that provide more advanced funnel analysis than GA4. Mixpanel's funnel report shows the conversion rate between each step and allows you to compare funnels across time periods (e.g., this month vs. last month) to measure the impact of optimization changes. It also supports "time-to-convert" analysis, showing how long users take to move from one step to the next.
Amplitude's funnel chart provides similar functionality with an emphasis on user behavior patterns. Its "compass" feature automatically identifies the most impactful steps for optimization by analyzing which step has the highest correlation with overall conversion. Amplitude also supports "retention funnels," which show what users do after converting (do they return and make another purchase, or do they churn?). This forward-looking analysis helps you optimize not just for the first conversion but for long-term customer value.
Building Funnels in Excel and Python
If your data is in a spreadsheet or database, you can build funnel analysis manually. In Excel, create a pivot table for each funnel step, counting the number of unique users who completed that step. Then calculate the conversion rate between consecutive steps: =step_n_users / step_n-1_users. Create a bar chart or waterfall chart to visualize the funnel.
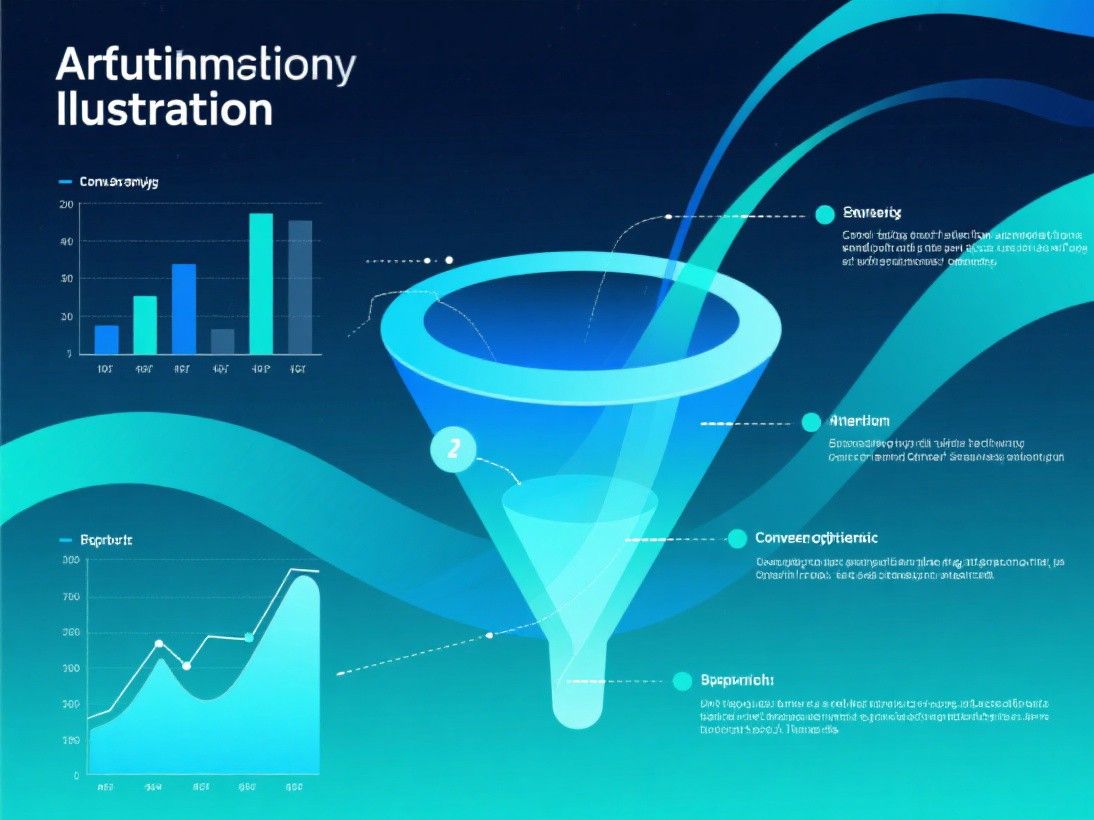
In Python, use Pandas to build funnels from event-level data. Assuming you have a DataFrame with user_id and event columns, sorted by timestamp: funnel_steps = ['page_view', 'add_to_cart', 'begin_checkout', 'purchase']; funnel_data = {}; for i, step in enumerate(funnel_steps): users_in_step = df[df['event'] == step]['user_id'].nunique(); funnel_data[step] = users_in_step. This counts the unique users at each step. Calculate conversion rates between steps and visualize with a Matplotlib bar chart.
Interpreting Funnel Results
The most important metric in funnel analysis is the drop-off rate between consecutive steps. A high drop-off rate (e.g., 60 percent of users who add to cart do not start checkout) indicates a problem at that step. The next step is to investigate why users drop off: is the checkout button hard to find? Are shipping costs revealed too late? Does the form ask for too much information?
Not all drop-off is bad. Some users may browse products without any intention of buying, so a drop-off between "visit product page" and "add to cart" is expected. The drop-off between "start checkout" and "complete purchase" is more concerning because it indicates intent to buy that was not fulfilled. Focus your optimization efforts on the steps where drop-off represents lost revenue, not just lost traffic.
Optimizing Based on Funnel Data
After identifying the step with the highest drop-off, run A/B tests to improve it. Common optimizations include: simplifying forms (fewer fields, autofill where possible), reducing friction in the checkout process (guest checkout option, multiple payment methods), adding social proof (reviews, testimonials, trust badges) at decision points, and improving page load speed (especially for mobile users who have slower connections).

After implementing changes, re-run the funnel analysis to measure the impact. Compare the new funnel to the previous one to see whether the conversion rate improved at the targeted step and whether the overall conversion rate increased. Funnel analysis is not a one-time exercise; it should be part of a continuous optimization cycle where you identify problems, test solutions, measure results, and iterate.
Optimizing Based on Funnel Data
After identifying the step with the highest drop-off, run A/B tests to improve it. Common optimizations include: simplifying forms (fewer fields, autofill where possible), reducing friction in the checkout process (guest checkout option, multiple payment methods), adding social proof (reviews, testimonials, trust badges) at decision points, and improving page load speed (especially for mobile users who have slower connections). After implementing changes, re-run the funnel analysis to measure the impact. Compare the new funnel to the previous one to see whether the conversion rate improved at the targeted step and whether the overall conversion rate increased. Funnel analysis is not a one-time exercise; it should be part of a continuous optimization cycle where you identify problems, test solutions, measure results, and iterate. Over time, this data-driven approach to optimization can significantly improve your conversion rates and revenue.